Project 01 · 2026
LoRaSim: SX1276 LoRa Link Simulator
A simulator that studies link quality between SX1276-based LoRa transmitters and receivers under different channel, distance, mobility and traffic conditions.
01.1Summary
How well a LoRa link performs in the field depends on many factors: spreading factor, bandwidth, transmit power, distance, environment and the other devices on the network. Trying every combination with hardware takes time, and some situations (moving nodes, heavy traffic, interference) are almost impossible to set up repeatably.
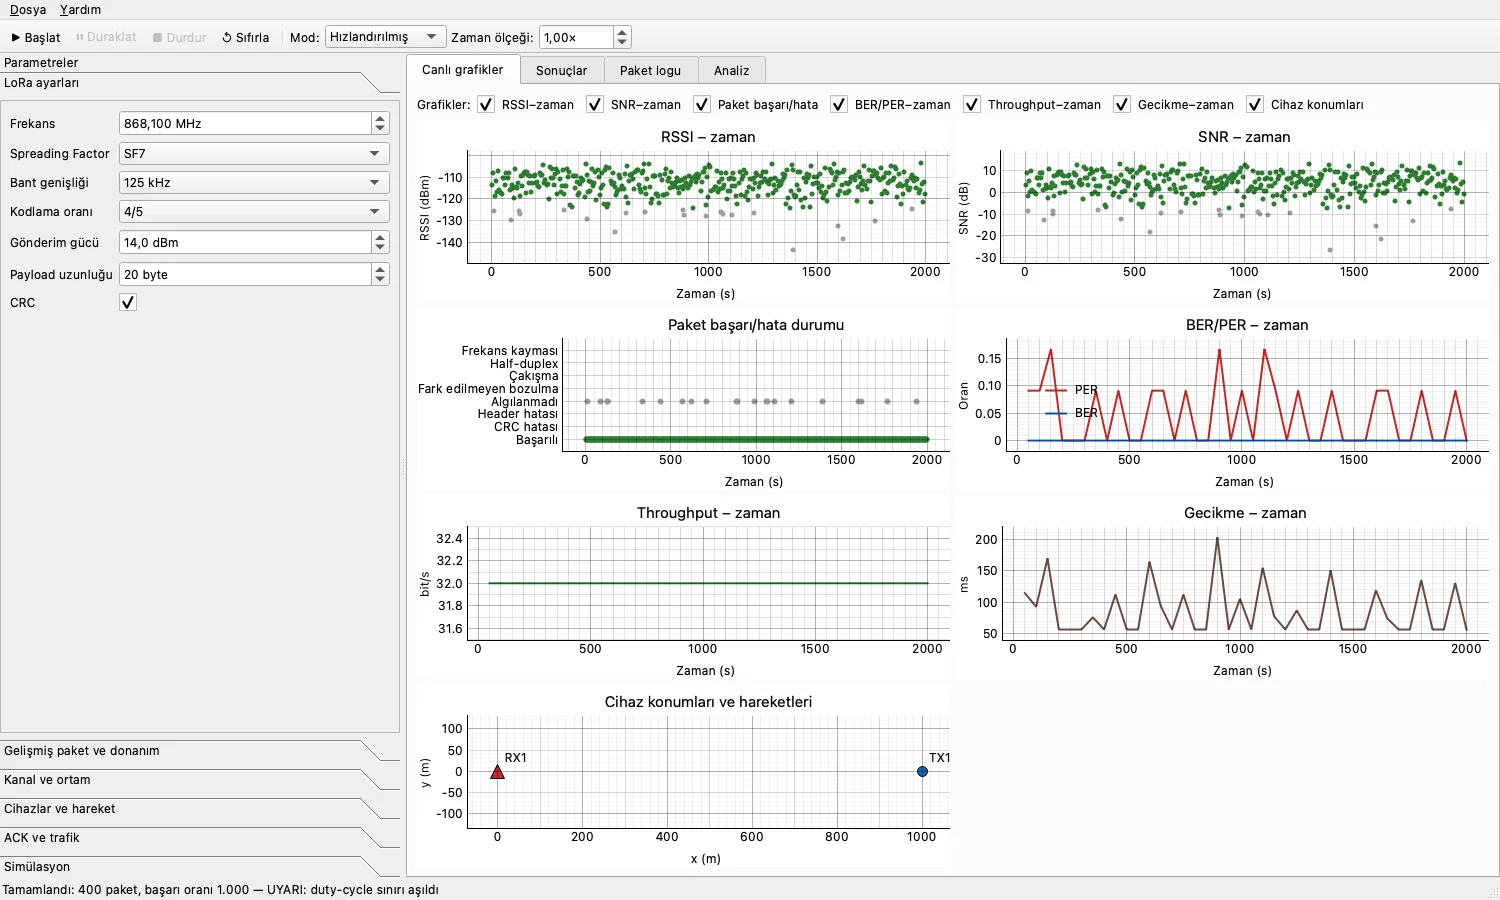
LoRaSim is a simulator I wrote to answer these questions on a computer. It works with the SX1276 module's parameters, models transmitters, channel and receivers in a discrete-event engine, shows results in live plots and saves them as CSV, JSON, PNG or PDF reports. Alongside the GUI there is a command-line interface that drives the same engine.
01.2Architecture
The GUI and the CLI both build the same SimConfig object, so validation rules and error messages live in one place. The engine derives all randomness from a single seed: the same settings and seed give exactly the same result in the GUI and on the command line. In the GUI the engine runs on a separate thread, and records are pushed to the screen every 200 ms.
01.3Physical-layer models
The simulator has two models, selectable from the GUI:
- Link-level model: decides each packet from the link budget, path loss, SNR and sensitivity without generating a waveform. The symbol error probability is computed numerically from LoRa's non-coherent orthogonal modulation equivalent; header and interleaver blocks, Hamming correction and the CRC-16 check are actually applied. This model is used for multi-node and long runs.
- CSS physical-layer model: generates the real chirp waveform (preamble, sync word, SFD, header and payload) and applies the channel to the signal; the receiver estimates and corrects the frequency offset from the preamble and demodulates with dechirp + FFT. It is about 25× slower than the link-level model at SF7 and about 270× slower at SF12.
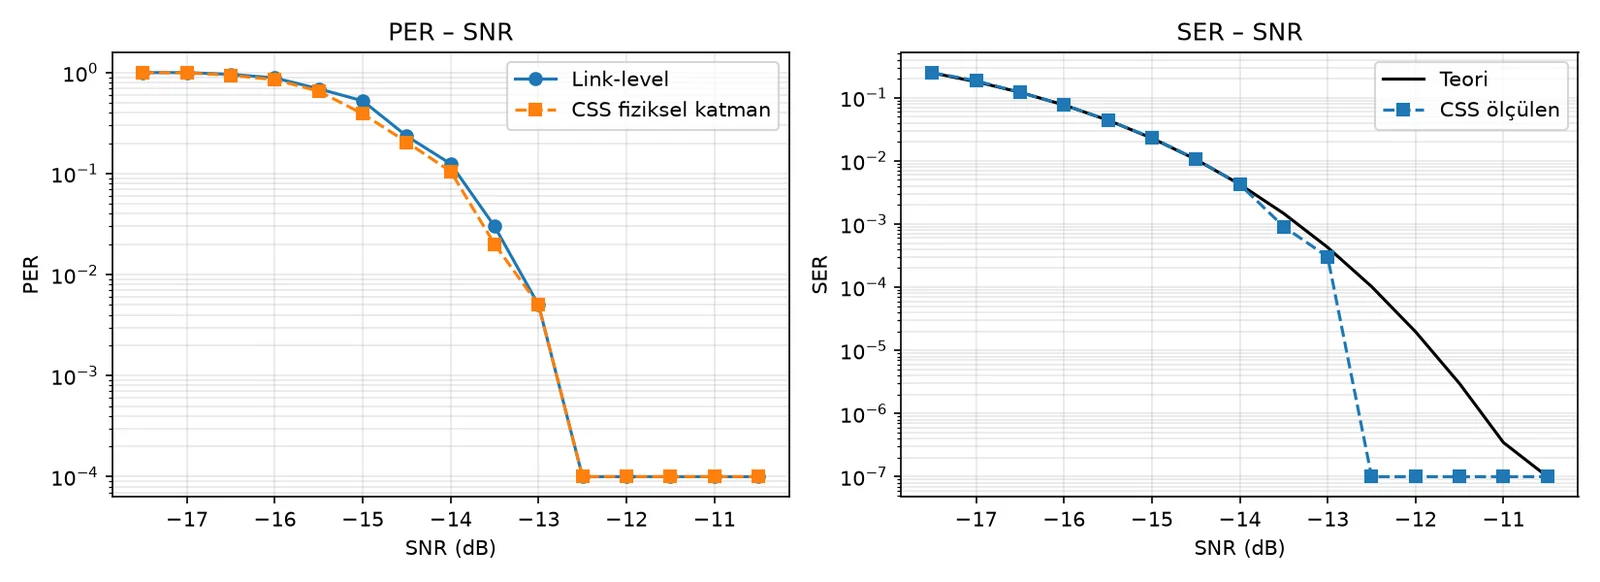
The two models were used to validate each other: their PER curves match at the same SNR points, and the SER measured with the CSS model follows the theoretical curve.
01.4Features
| LoRa settings | SF7–SF12; 125 / 250 / 500 kHz; CR 4/5–4/8; power, frequency (137–1020 MHz), payload, CRC; preamble, implicit header, sync word, IQ inversion, LDRO |
|---|---|
| Environments | Free space, open area, rural, urban, dense urban, indoor |
| Channel | Free-space and log-distance path loss, AWGN, shadowing, Rayleigh/Rician fading, multipath (COST 207, ITU Indoor A), time-varying channel, Doppler, crystal frequency offset, external interference |
| Collisions | Capture effect: 6 dB threshold for the same SF, an SIR threshold matrix across SFs |
| Network | Multiple transmitters and receivers; distance, Cartesian or random placement; half-duplex |
| Mobility | Constant velocity, random walk, route, circular |
| Traffic | ACK and retransmission, transmit queue, duty-cycle control (warn / enforce) |
| Metrics | BER, SER, PER, packet loss, RSSI, SNR, throughput, latency, ACK success, duty-cycle violations, energy from SX1276 currents, maximum working range |
| Analysis | Environment, distance, power and SF sweeps; link-level ↔ CSS comparison |
| Outputs | CSV, JSON, PNG, PDF report |
01.5Analysis
The Analysis tab and the --sweep option vary one parameter while holding the rest fixed. Every point of a sweep runs with the same seed, so the differences between points come from the parameter, not from randomness.
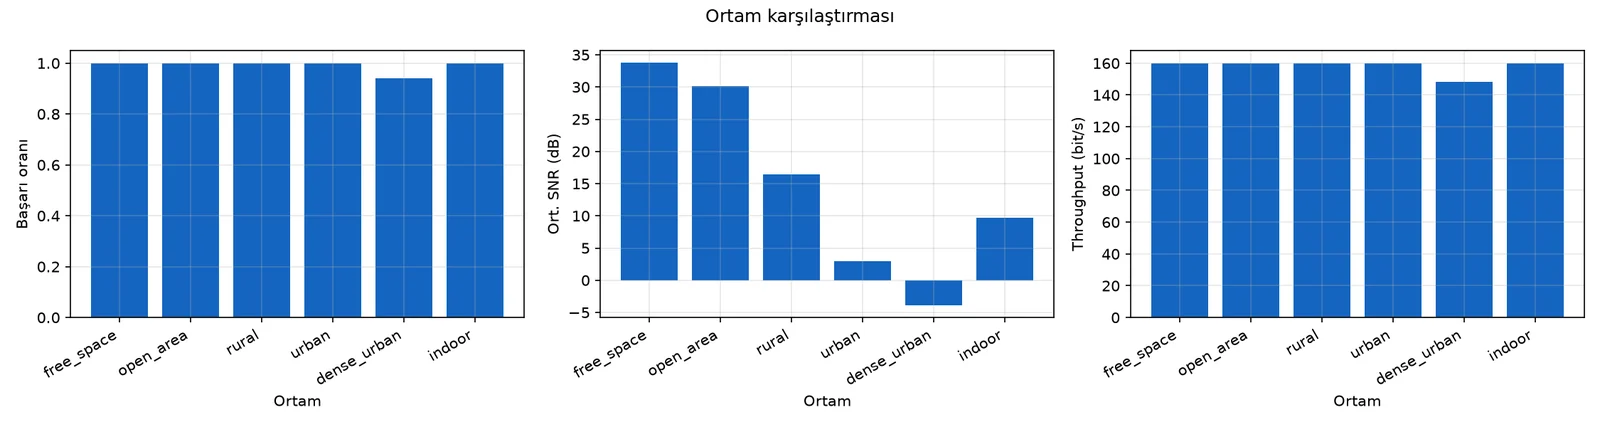
python -m lorasim --sweep environment --distance 2000 --png ortam.png
python -m lorasim --max-range 0.9 --env rural --sf 10
python -m lorasim --compare-models --sf 9 --png modeller.png01.6Verification
The project has more than 270 automated tests. They cover airtime and sensitivity calculations, Monte Carlo validation of the SER model, channel effects, multi-node and collision behaviour, ACK and duty-cycle logic, CSS modulation, memory stability in long runs, and the GUI. Each of the ten success criteria I defined in the plan is checked by its own test. The tests run on GitHub Actions with Python 3.11 and 3.12 on every push.
01.7Results and lessons
- The SNR thresholds in the datasheet are 0.5–2.5 dB more pessimistic than the theoretical error model, so in the simulation packet loss is mostly set by the sensitivity threshold; the theoretical SER curve alone gives optimistic results.
- The environment profiles use typical values from the literature and have not been calibrated with field measurements. Every value can be changed in the GUI; for a real deployment they should first be tuned against field data.
- Having two models built with different approaches agree with each other turned out to be the most effective way to catch bugs in both.
- CI showed the process crashing at exit on Linux + Python 3.11 even though all tests passed. The cause was a reference-counting bug in PySide6 6.12.0 (every call returning
None); that release was excluded from the dependencies and a test that catches the bug was added.
01.8Links
- GitHubFatihAksoyEEE/LoRaSim ↗